Call Now 202-960-4596
Medical malpractice payouts are getting bigger. Across the U.S., the average payment topped $415,000 in 2023, a record high and up 33% from a decade earlier.
The consequences of medical mistakes can be severe, slowing patients’ recovery, creating new health issues, or even resulting in death. Serious mistakes are rare, but over the years, surgeons have operated on the wrong side of patients’ brains, amputated the wrong leg, and failed to provide anesthetic drugs before starting surgery, which left a patient paralyzed but not anesthetized and able to feel all the pain. Understandably, the damage caused by medical malpractice can be emotional, psychological, and financial, on top of physical.
Medical malpractice claims hold health professionals accountable, help identify systemic issues, and provide a means of compensation for patients who have suffered from medical negligence. While more than half of the states have a cap on medical malpractice claims, the number of high-paying settlements is ticking up.
Last year, there were 284 payouts for at least $2 million, which is also a record high and up 56% from 2013, according to data from the U.S. Department of Health and Human Services’ National Practitioner Data Bank. Overall, $2 million payouts made up just 3% of all claims.
Traditionally, however, indemnity payments have been relatively rare. Between 1991 and 2005, malpractice claims were made against just 7.4% of all physicians, and only 12% of those claims actually led to a payout, according to research published in the New England Journal of Medicine.
Yet while the annual number of malpractice payouts has fallen over time – there were 19,772 payments in 2001, compared with 11,248 in 2023 – the national figures mask the wide variation at the state level. They also don’t capture the non-financial penalties that negligent providers can face, such as losing their clinical privileges or membership in professional groups.
To determine the states with the most medical malpractice claims, Regan Zambri Long Personal Injury Lawyers, PLLC, used data from the National Practitioner Data Bank from 2019 through March 2024. Those data points include the rates of disciplinary actions and medical malpractice payments per 1,000 practitioners, as well as the average malpractice payout in that time period.
Georgia is the worst state for medical malpractice claims. It has a high average payout for claims ($518,453), as well as above-average rates of disciplinary actions (297) and malpractice payouts (91.6) per 1,000 practitioners. Between 2019 and March 2024, Georgia had a total of 1,597 payments, making it one of only 16 states to cross the 1,000 mark in that time frame.
The 10 worst states overall tended to score poorly across the board. No. 2 Hawaii, for example, had one of the highest average payments ($683,936), while No. 8 Wisconsin had among the highest disciplinary action rates (333.9) and No. 7 South Carolina and No. 10 Pennsylvania both landed among the top for payment rates (83.4 and 102.8, respectively).
On the other side of the spectrum, Missouri is the safest state when it comes to medical malpractice claims, with 120.7 disciplinary actions and 45.9 malpractice payments per 1,000 practitioners. Notably, its average payout was $375,259, landing in the middle of the pack. Overall, there were 964 malpractice payments in Missouri between 2019 and March 2024, and 2,535 disciplinary actions.
The 10 safest states spanned across the U.S. For example, No. 7 California had one of the lowest average malpractice payments ($242,994), while No. 8 North Dakota and No. 9 Vermont had among the lowest malpractice payment rates (16.8 and 21.5). When it came to disciplinary actions, the District of Columbia, which ranked No. 3 overall, had the second-lowest rate (98.2), after only New York (92.5), which landed in the middle overall.
Click on any state to see data for each category analyzed as well as how the state ranked in each specific category.
Overall, there were 54,037 medical malpractice payments in the U.S. between 2019 and March 2024, with an average payment of $386,954. Minnesota had the highest average payment ($788,037), while Texas had the lowest ($223,577). In terms of total payments, New York had the most malpractice liability (more than $3 billion), and North Dakota had the least ($15.4 million) in the time period studied.
Healthcare organizations make medical malpractice payments when a patient claims that a professional failed to provide healthcare services, resulting in a legal settlement or judgment in their favor. The U.S. had, on average, 59.3 medical malpractice payments for every 1,000 practitioners from 2019 to early 2024. New York had the highest rate, at 129.2, while North Dakota had the lowest rate, at 16.8. Considered another way, that means that there was one malpractice payment for every 7.7 practitioners in New York, and one for every 59.7 in North Dakota.
Adverse action reports track disciplinary measures taken against healthcare providers, such as revoking their clinical privileges, organizational membership, licensure, inclusion in the Medicare or Medicaid programs or another step. From 2019 to March 2024, there were 238.1 disciplinary actions reported per 1,000 practitioners in the U.S. That rate was highest in Colorado (403.6) and lowest in New York (92.5). That means there was one disciplinary action for every 2.5 practitioners in Colorado, and one for every 10.8 in New York.
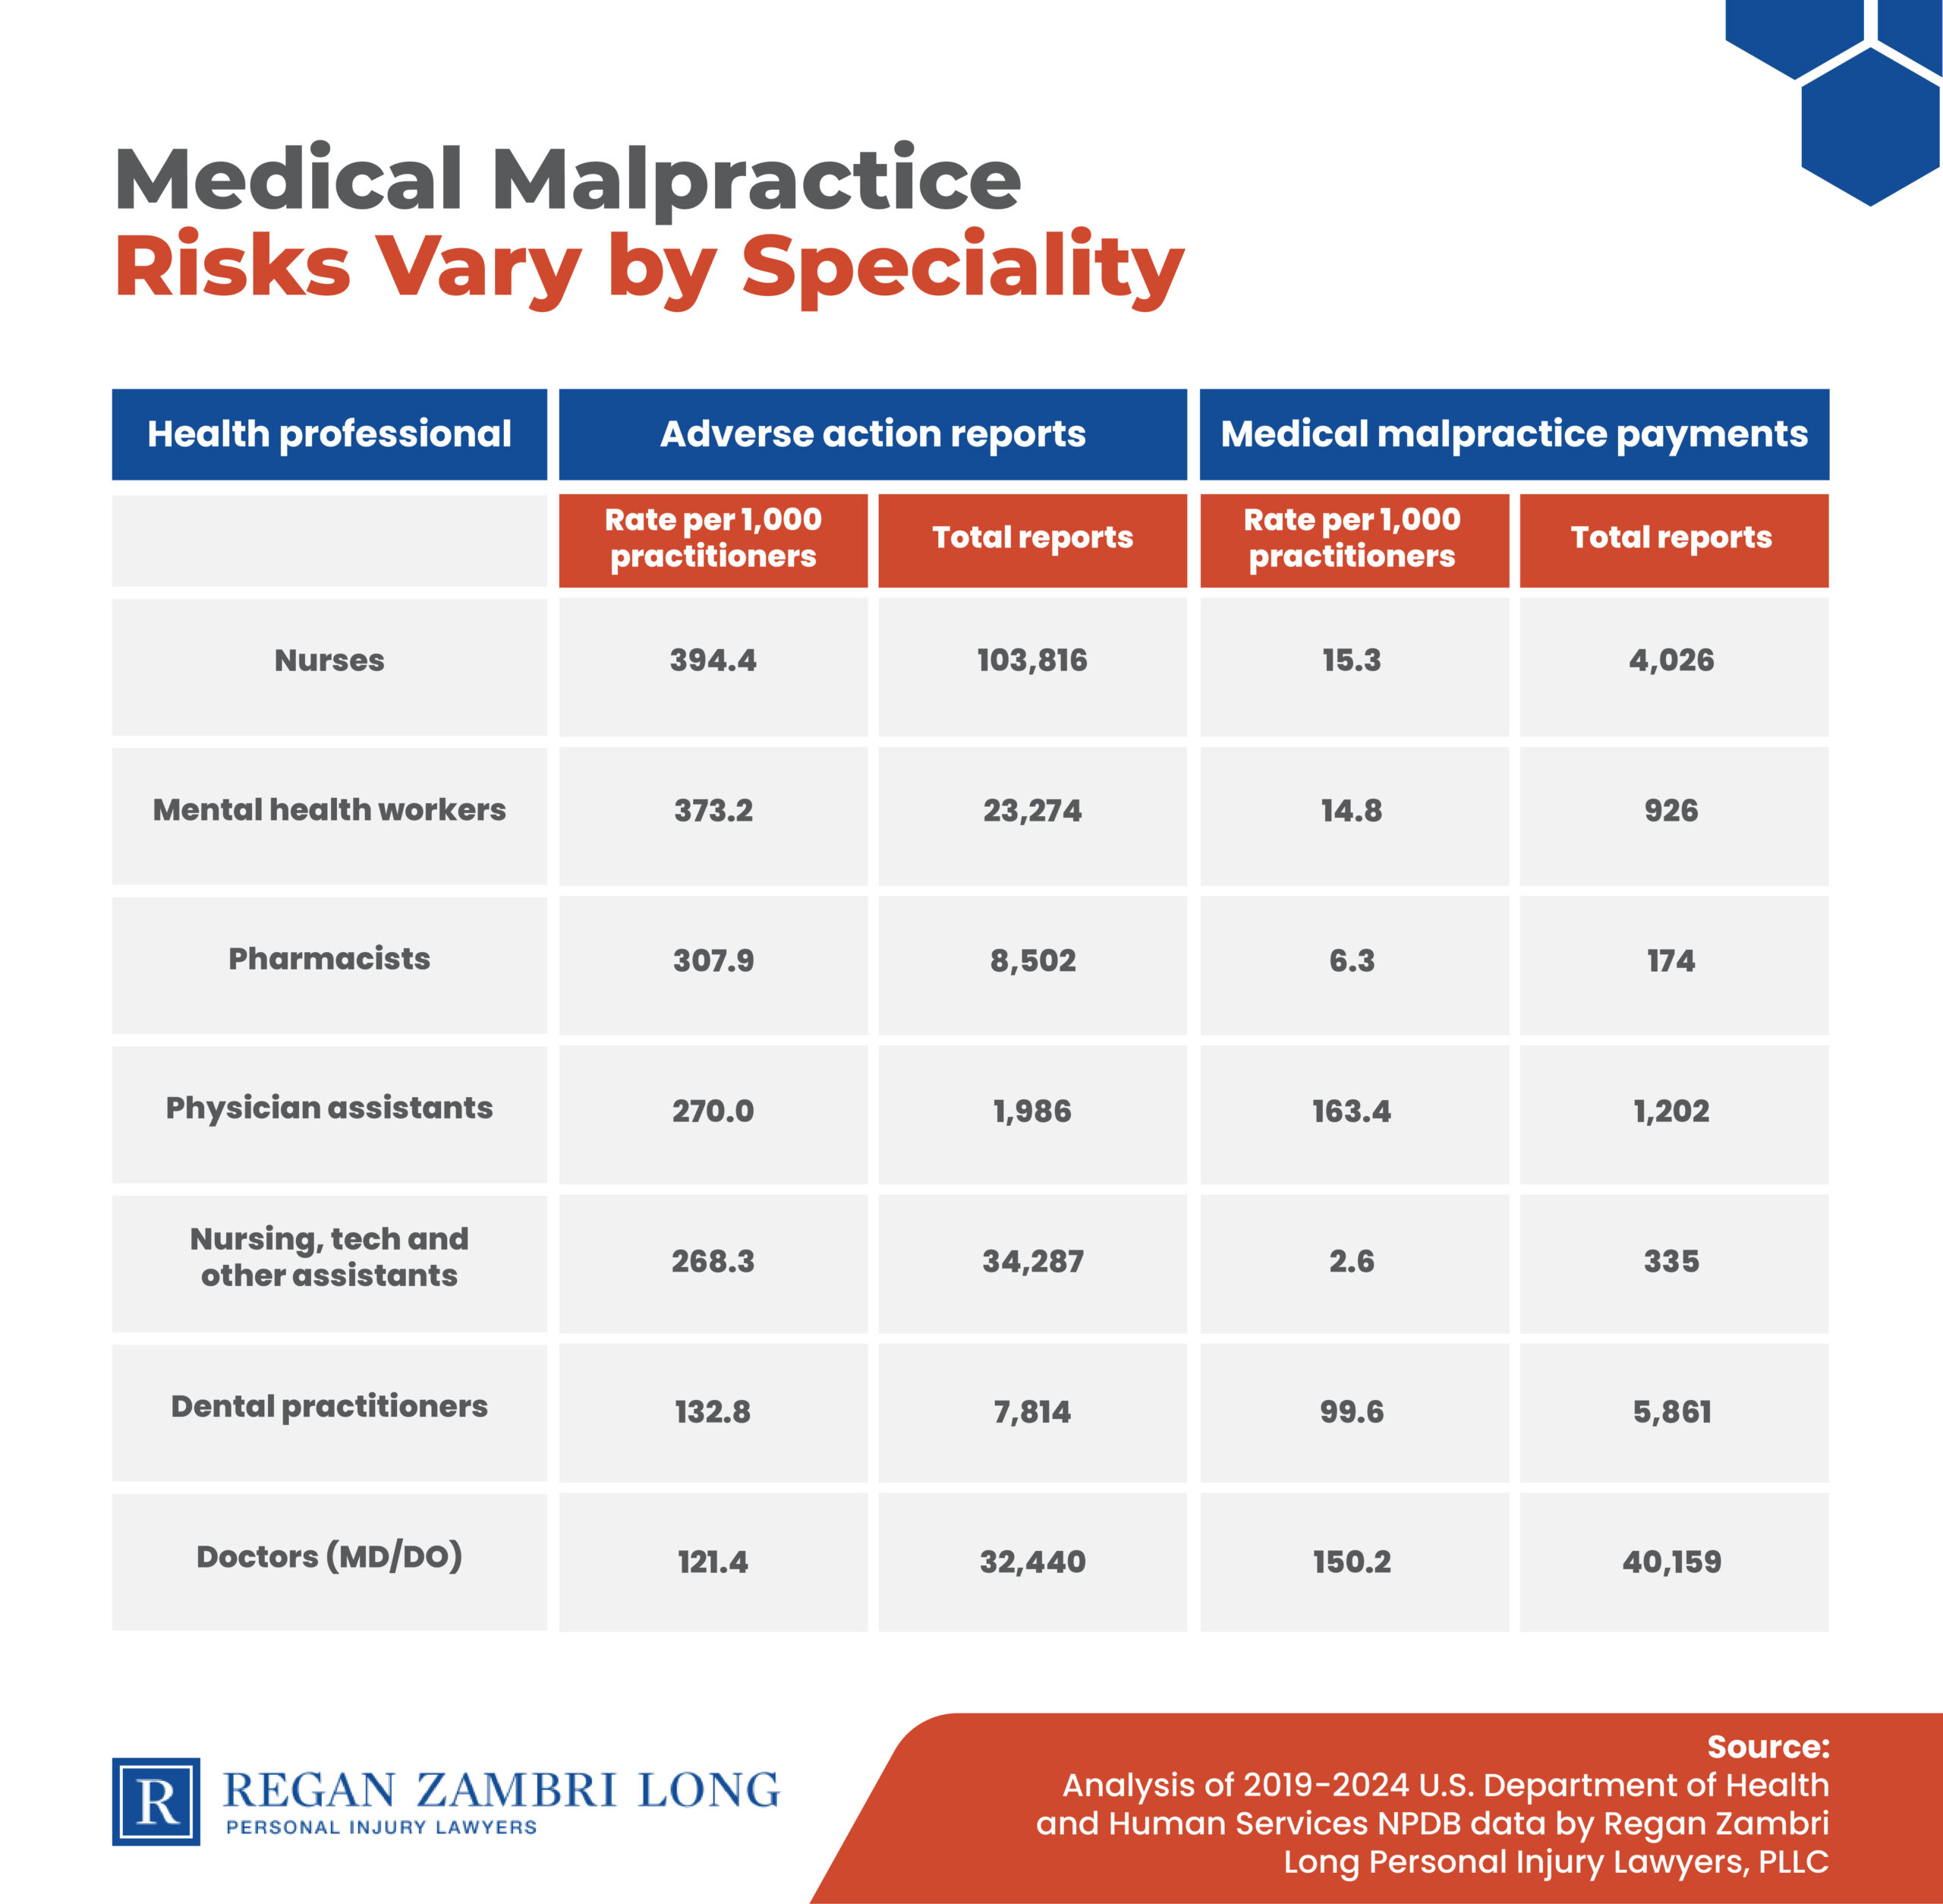
Some healthcare professionals are at greater risk than others – but their risk differs based on the type of measure in question. When it comes to disciplinary actions, nurses are the greatest liability, with 394.4 adverse action reports per 1,000 practitioners. In total, there were 103,816 disciplinary actions taken against nurses from 2019 to March 2024, far more than any other specialty.
Meanwhile, physician assistants are more likely than anyone else to be subject to medical malpractice payments, at a rate of 163.4 per 1,000. However, keep in mind that there were only 1,202 payments made for PAs in the study period, compared with a total of 40,159 payouts for malpractice involving doctors, who also had a high rate of 150.2 payouts per 1,000 practitioners.
This analysis indicates that while medical malpractice is a challenge across the U.S., there are major disparities between the states and even across medical specialties. The findings underscore the importance of targeted efforts to mitigate malpractice risks and improve patient safety – as well as effective advocacy for those who have suffered due to medical negligence.
If you are injured because a medical professional neglected their professional duty, you have the right to pursue financial compensation. We all expect doctors, nurses, and healthcare providers to provide qualified care. A medical malpractice lawyer from Regan, Zambri Long PLLC may be able to help.
The legal team at Regan Zambri Long has over 30 years of experience and have a reputation for going above and beyond in our fight to get you the compensation you deserve.
We review your case for free and there is no obligation to hire us, so don’t hesitate to call to learn more about your options today.
We used data from the National Practitioner Data Bank, run by the U.S. Department of Health and Human Services, to determine which states have the strongest indicators of medical malpractice. The data are from January 2019 to March 2024. We used a Z-score distribution to scale each metric relative to the mean across all 50 states and Washington, D.C., and capped outliers at +/-2. A state’s overall ranking was calculated using its average Z-score across the three metrics. Here’s a closer look at the data we used: